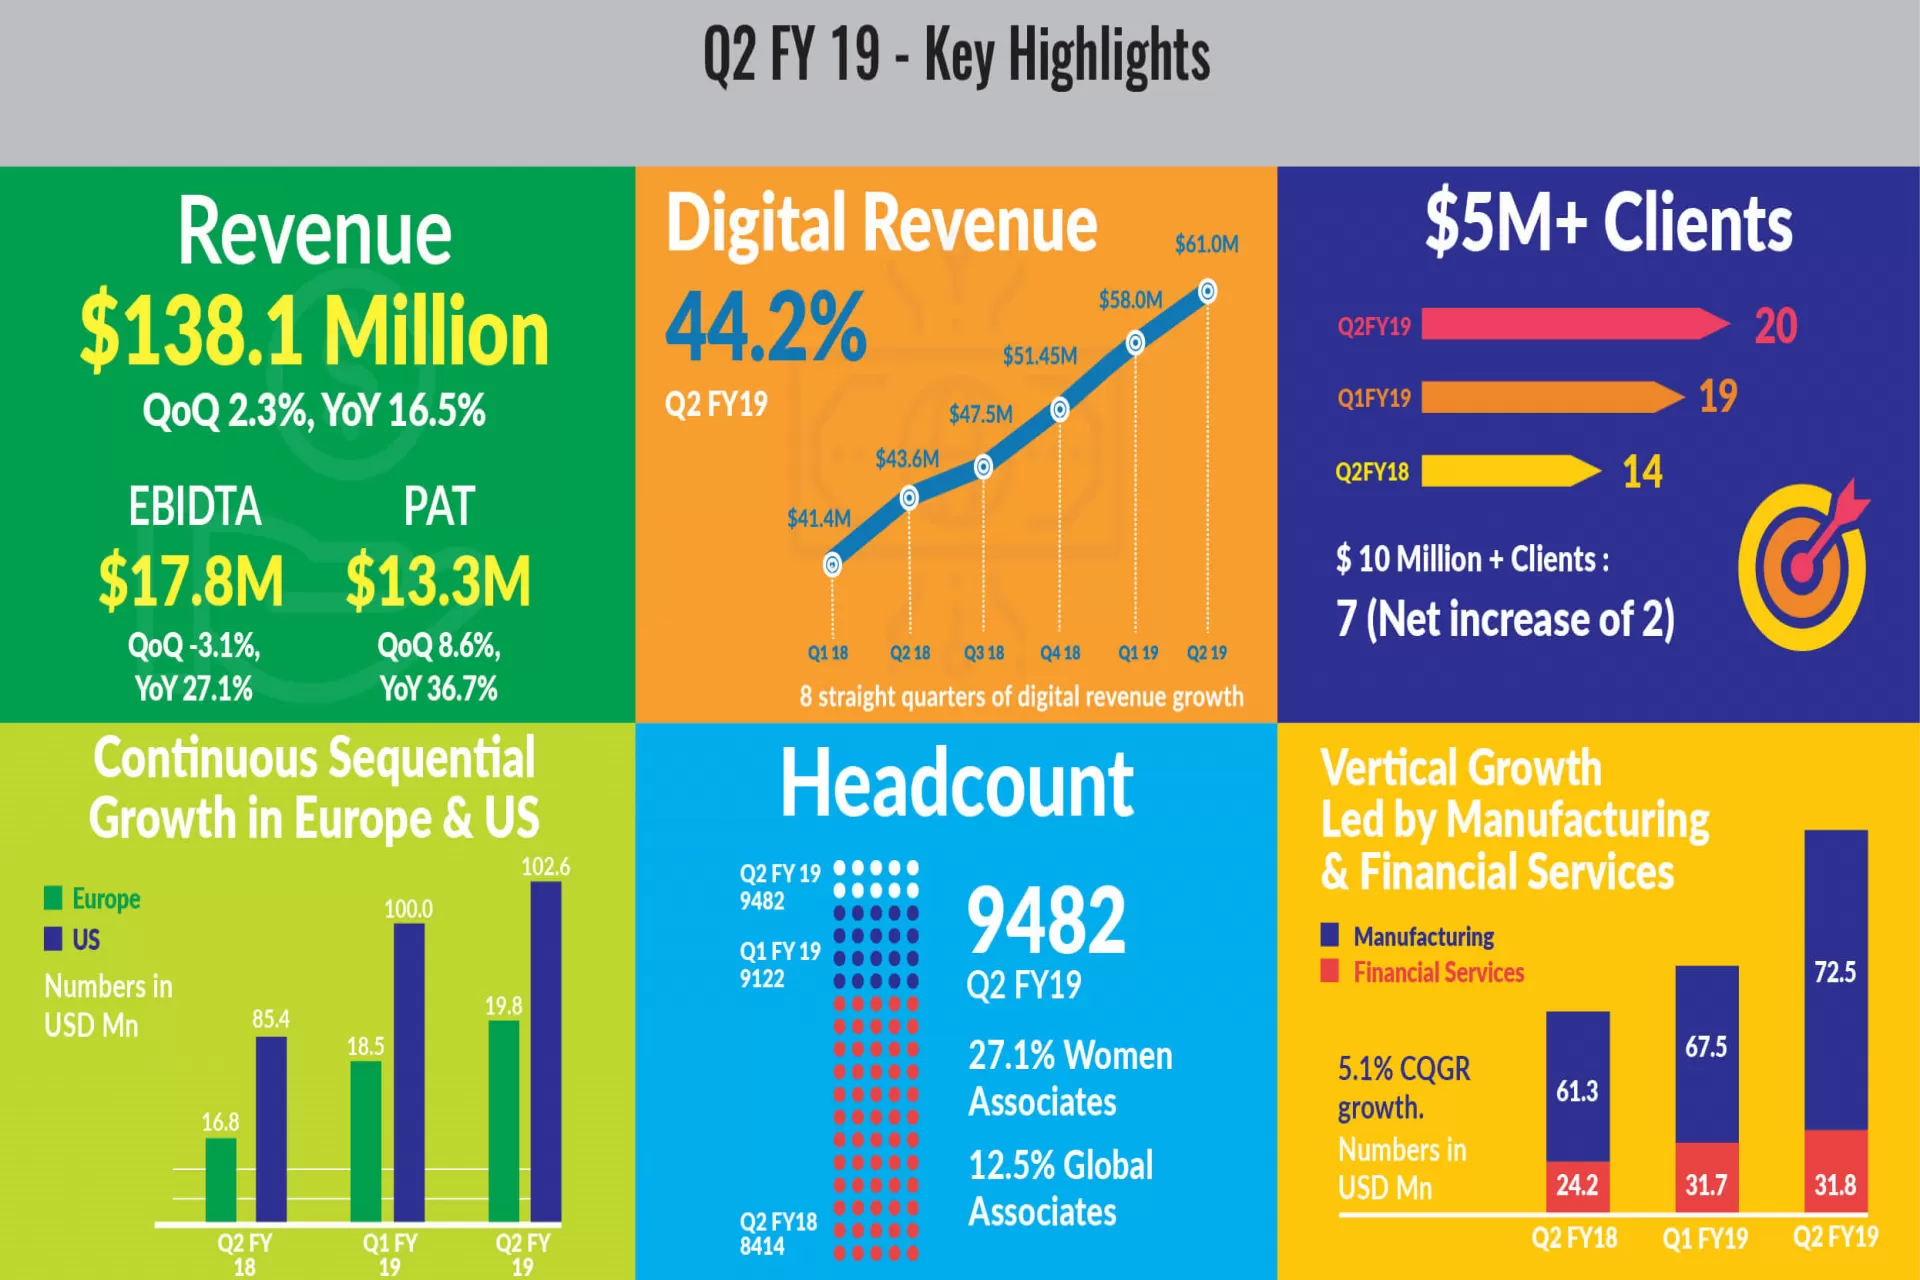
Zensar reports 36.7% YoY increase in PAT and 16.5% increase in Revenue during Q2FY19
Press Release | 23 Oct 2018
Pune, India, October 23, 2018: Zensar Technologies, a leading digital solutions and technology services company that specialises in partnering with global organisations on their Digital transformation journey, announced its audited consolidated financial results for its second Quarter ending September 30, 2018 of the fiscal year 2018-2019.
Financial Highlights: The Company reported QoQ revenue growth of 2.3% and YoY growth of 16.5% in USD terms. In constant currency the QoQ growth was at 4.1% and YoY growth at 17.5%. PAT grew by 8.6% QoQ and 36.7% YoY. Digital services continue to grow and have moved up 5.2% sequentially and 39.8% on yearly basis. Digital now contributes 44.2% of Q2FY19 revenue.
Sandeep Kishore, Chief Executive Officer and Managing Director, Zensar Technologies said, “We have remained focused on our digital strategy resulting in the consistent growth in our digital revenues which are now at 44.2% of our total business in Q2. With our recent acquisition of Indigo Slate, Zensar is well poised to offer differentiated digital solutions to global enterprises. After great success of our Return on Digital® platforms, we have now launched RoD NeXT, Return on Digital with New and Exponential Technologies; platform for our clients.”
Navneet Khandelwal, Chief Financial Officer, Zensar Technologies said, “We have seen sequential growth in constant currency terms across all geographies. We have taken initiatives through H1FY19 to optimize costs and deliver on our digital capabilities. This has resulted in H1FY19 EBITDA to be at 13.3% in comparison to 11.1% in H1FY18 which is a 40.5% YoY growth in absolute terms.”
Business Updates: The company had total bookings of $290m+ in H1FY19, including more than $120m in Q2FY19. Significant among these were -
- End to end infrastructure management requirements for Ruffer, a leading UK investment management company
- Cloud computing infrastructure implementation for a large US based medical company
- JD Edwards implementation for a US company that develops aesthetic medical products
- Warehouse Management System (WMS) Upgrade project for a leading supermarket chain in the United States
- Big Data and Customer Analytics for a large US based hi-tech global company
- End-user computing and data-center services for a leading UK oil and gas company
- Testing mandate for a leading British multinational life insurance and financial services company
Corporate Excellence Snapshot in Q2 FY 19:
- Zensar is mentioned in Gartner ‘Competitive Landscape: Consulting and System Integration Service Providers for Robotic Process Automation’
- Zensar Recognized as an Aspirant in Enterprise QA Services by Everest Group PEAK Matrix™
- Zensar recognized as a leader in Zinnov Zones - Retail Digital Services Ratings
- Zensar mentioned in Gartner Hype Cycle for Enterprise Architecture, 2018
- Foolproof, a Zensar Company featured in a Nelson Hall Report - UX-UI Consulting and Implementation Services Vendor Assessment
- Zensar mentioned in Nelson Hall report for IT Services: Cognitive IT Infrastructure Management
- Foolproof, a Zensar company has been placed in the Top 10 Design and Build Agencies category by Econsultancy-one of the most respected digital marketing and e-commerce industry authorities in the UK
Corporate Initiatives:
- Zensar acquires US West Coast based Indigo Slate, a digital marketing focused customer experience agency
- Zensar Partners with Ocean Discovery Institute on Youth STEM Programs
- Zensar Joins Oracle Cloud Managed Service Provider Program
Note: All numbers are as per the Ind-AS reporting standard
Q2 FY 19 Revenue and profitability snapshot (US$)
|
Particulars |
Q2 FY19 |
Growth |
||||||
|
USD Mn |
INR Cr |
Q-o-Q |
Y-o-Y |
|||||
|
USD |
INR |
CC |
USD |
INR |
CC |
|||
|
Revenue |
$ 138.1 |
₹ 968.7 |
2.3% |
7.1% |
4.1% |
16.5% |
27.0% |
17.5% |
|
EBITDA |
$ 17.8 |
₹ 125.0 |
(3.1%) |
1.4% |
|
27.1% |
38.7% |
|
|
EBIT |
$ 14.6 |
₹ 102.6 |
(6.7%) |
(2.4%) |
|
28.8% |
40.5% |
|
|
PAT |
$ 13.3 |
₹ 93.4 |
8.6% |
13.7% |
|
36.7% |
49.1% |
|
Q2 FY 19 Revenue Growth in Constant Currency
|
Particulars |
Segments |
Q2 FY19 |
|
QoQ |
||
|
Consolidated |
For the Company |
4.1% |
|
Geography |
US |
2.8% |
|
Europe |
10.9% |
|
|
Africa |
5.6% |
|
|
RoW |
0.4% |
|
|
Services |
Digital and Application Services, DAS |
4.1% |
|
Digital Services |
7.0% |
|
|
Core Application Services |
1.7% |
|
|
Cloud and Infrastructure Services, CIS |
4.2% |
|
|
Cloud, Digital Led next gen CIS |
6.6% |
|
|
Core Infrastructure Services |
3.2% |
|
|
Third Party Maintenance |
2.8% |
|
|
Total Digital Services |
7.0% |
|
|
Industry |
Hitech and Manufacturing |
8.4% |
|
Hitech |
7.7% |
|
|
Mfg. |
10.2% |
|
|
Retail and Consumer Services |
(8.7%) |
|
|
Financial Services |
5.0% |
|
|
Insurance |
1.2% |
|
|
Banking |
22.8% |
|
|
Emerging |
56.2% |


