Zensar reports 17.1% YoY increase in Revenue during Q3 FY19
Press Release | 21 Jan 2019
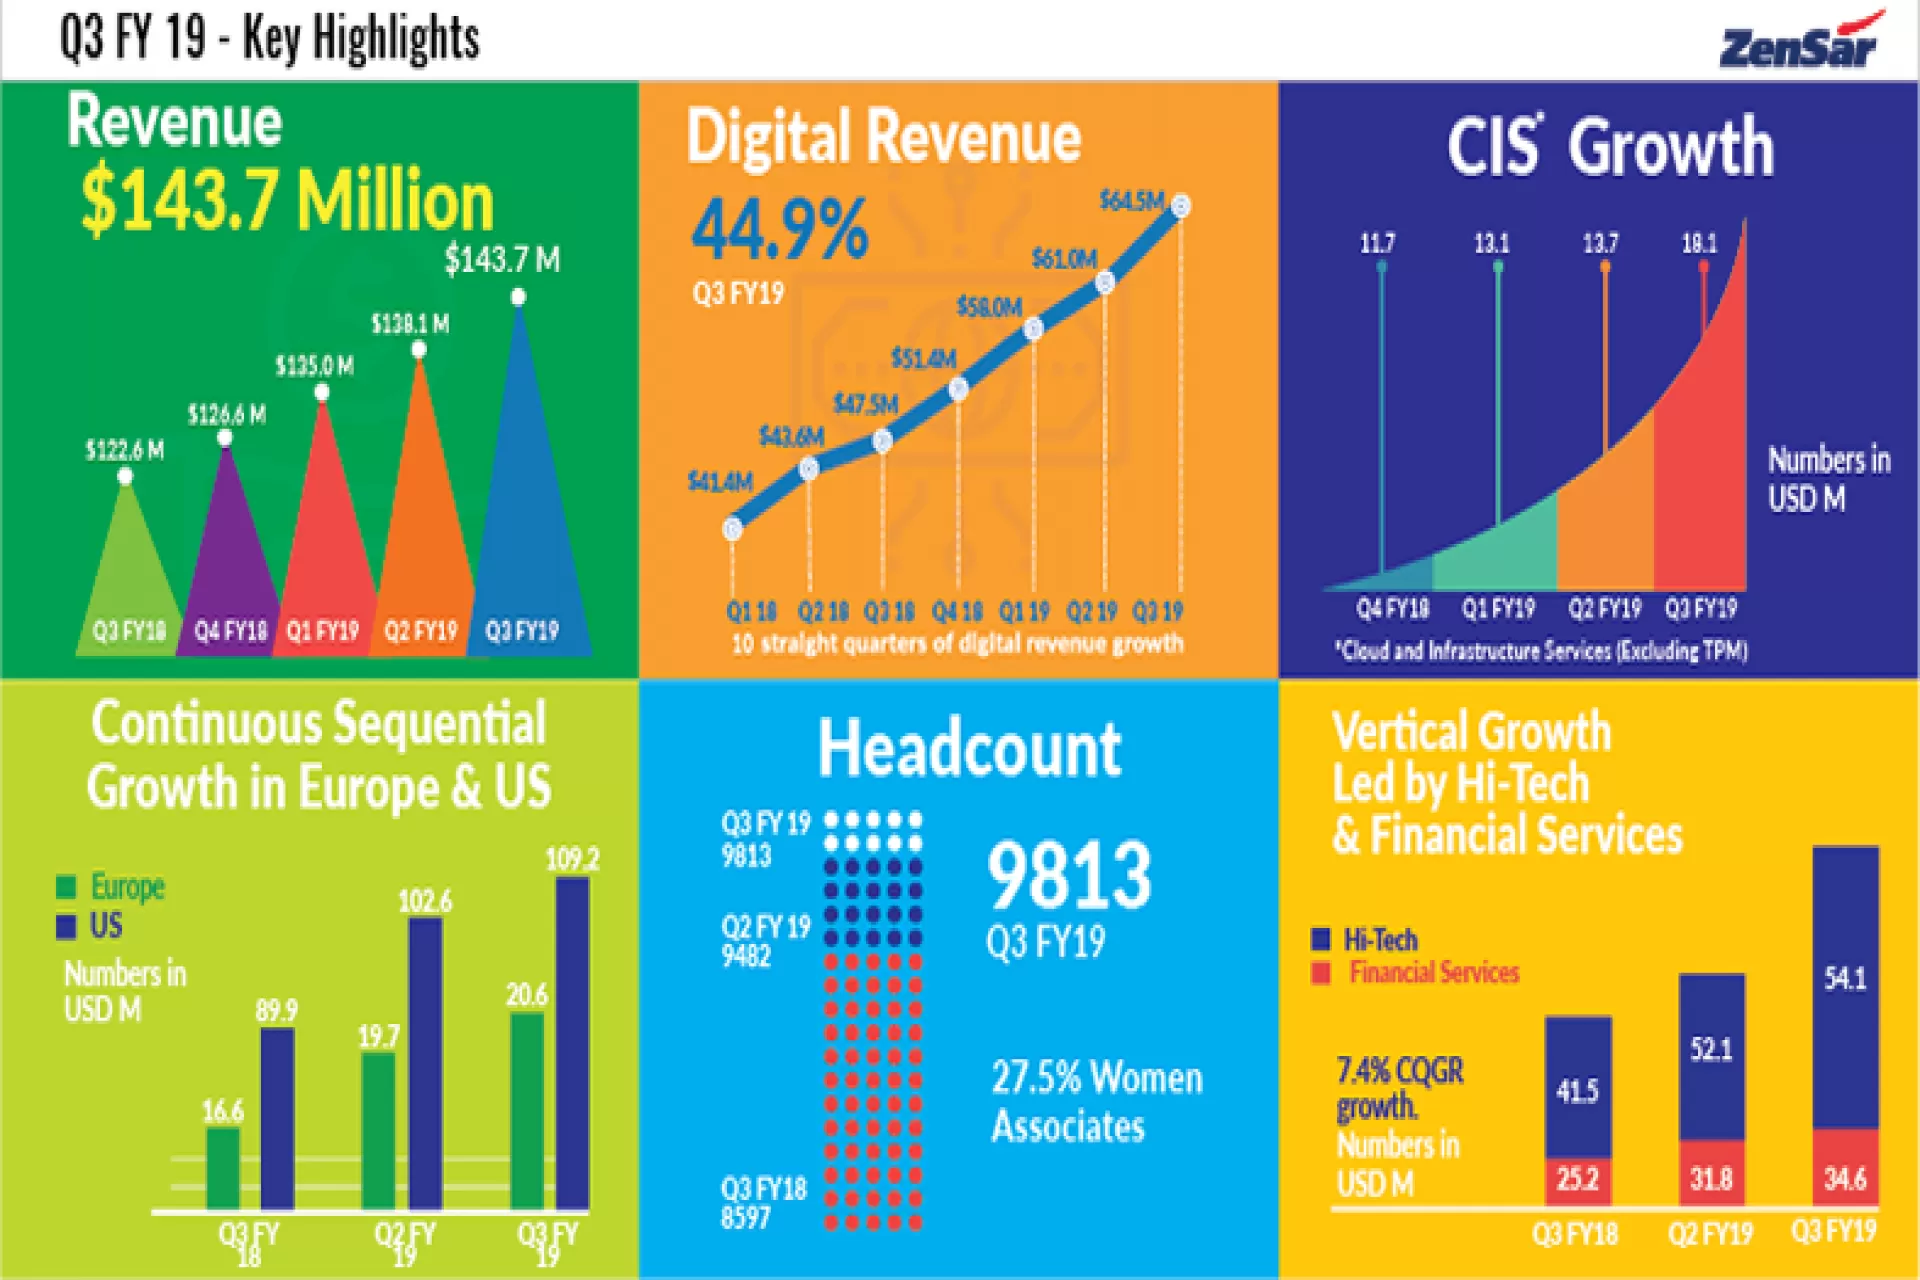
Pune, India, January 21, 2019: Zensar Technologies, a leading digital solutions and technology services company that specialises in partnering with global organisations on their Digital transformation journey, announced its audited consolidated financial results for its third Quarter ending December 31, 2018 of the fiscal year 2018-2019.
Financial Highlights: The Company reported QoQ revenue growth of 4.0% and YoY growth of 17.1% in USD terms. In constant currency the QoQ growth was at 4.5% and YoY growth at 17.6%. Digital services continue to grow and have moved up 5.8% sequentially and 35.9% on yearly basis. Digital now contributes 44.9% of Q3FY19 revenue.
Several of the large wins over the last quarters are currently in transition, impacting the EBITDA in the current quarter. Q3 EBIDTA was at 10.9%, a decline of 5.6% on YoY basis.
Sandeep Kishore, Chief Executive Officer and Managing Director, Zensar Technologies said, “Digital, which has been the foundation of our strategy, continues to drive growth with a sequential increase for the 10th consecutive quarter. Our recent launch of RoD NeXT (New and Exponential Technologies) is gaining traction amongst our customers, setting the path for future growth. Our focus on automation and our digital platforms has enabled us to win some significant large deals, driving business growth in Q3FY19, with the total TCV booking crossing the $200M mark for the first time.”
Navneet Khandelwal, Chief Financial Officer, Zensar Technologies said, “Our revenue momentum continued very well in Q3 with 4.5% sequential growth in constant currency. EBITDA Margins were impacted due to transition costs on the large deals that we have won over the last 2 qtrs. Our rigour in operations ensured strong cash generation during the quarter.”
Business Updates: The company had total bookings of $500m+, YTDFY19, including more than $200m in Q3FY19. Significant among these were -
- Infrastructure management including managed security mandate for a global aerospace major
- Warehouse management for a leading US based department store chain
- Application Management services project for a large US based High-tech corporation
- Performance engineering mandate for a global ecommerce product company
- Digital commerce implementation for a US based women’s clothing brand
- Infrastructure and Network services mandate for EBRD (European Bank for Reconstruction and Development)
- Application Development and Integration; Building and Implementing Responsive UI for a leading UK based motoring group
- Automation work for a leading South African financial services corporation
Business Excellence:
- Zensar mentioned in Gartner for Tech CEO’s research - ‘Revitalize Application Management Services With Kanban’
- Zensar named as an Aspirant in the Everest Blockchain Services PEAK Matrix™ Assessment
- Zensar named as an Aspirant in Everest Group IoT PEAK Matrix™ Assessment
- Zensar has been featured as a major contender in the Digital Services – PEAK Matrix Assessment and Market Trends 2019: Design and Innovation to Power the Next Wave of Digital Zensar mentioned as a disruptor in the Intelligent Automation Services RadarView TM
- Zensar mentioned as a challenger in the Blockchain Services Radar View TM
- Zensar mentioned in the Global Software Testing Services Market Overview 2018
- Zensar recognized as an Innovator in Avasant’s Hybrid Enterprise Cloud Services RadarView™ Report
- Zensar featured in Novarica’s Market Navigator Report: Business Intelligence Solutions for Insurers 2018
- Zensar positioned as a Major contender in Property and Casualty (P and C) Insurance Digital Services PEAK Matrix™ 2019-Reimaginging Products and Stakeholders Experience
Awards and Recognitions:
- Zensar wins People Matters L and D Award for ‘Best in Future Tech Skill Building’
- Zensar featured in the 100 Best Company for Women in 2018 BCWI Study
Note: All numbers are as per the Ind-AS reporting standard
Q3 FY 19 Revenue and profitability snapshot (US$)
|
Particulars |
Q3 FY19 |
Growth |
||||||
|
USD Mn |
INR Cr |
Q-o-Q |
Y-o-Y |
|||||
|
USD |
INR |
CC |
USD |
INR |
CC |
|||
|
Revenue |
$ 143.7 |
₹ 1035.5 |
4.0% |
6.9% |
4.5% |
17.1% |
30.5% |
17.6% |
|
EBITDA |
$ 15.6 |
₹ 112.5 |
(12.5%) |
(10.1%) |
|
(5.6%) |
5.2% |
|
|
EBIT |
$ 12.3 |
₹ 88.7 |
(15.8%) |
(13.5%) |
|
(12.4%) |
(2.4%) |
|
|
PAT |
$ 7.7 |
₹ 55.3 |
(42.4%) |
(40.8%) |
|
(15.9%) |
(6.4%) |
|
Q3 FY 19 Revenue Growth in Constant Currency
|
Particulars |
Segments |
Q3 FY19 |
|
QoQ |
||
|
Consolidated |
For the Company |
4.5% |
|
Geography |
US |
6.6% |
|
Europe |
5.7% |
|
|
Africa |
(3.6%) |
|
|
RoW |
(-39.6%) |
|
|
Services |
Digital and Application Services, DAS |
2.1% |
|
Digital Services |
5.9% |
|
|
Core Application Services |
(1.0%) |
|
|
Cloud and Infrastructure Services, CIS |
17.4% |
|
|
Cloud, Digital Led next gen CIS |
10.1% |
|
|
Core Infrastructure Services |
55.6% |
|
|
Third Party Maintenance |
(11.5%) |
|
|
Total Digital Services |
6.3% |
|
|
Industry |
Hitech and Manufacturing |
1.1% |
|
Hitech |
3.8% |
|
|
Mfg. |
(5.7%) |
|
|
Retail and Consumer Services |
1.1% |
|
|
Financial Services |
9.6% |
|
|
Insurance |
6.5% |
|
|
Banking |
22.3% |
|
|
Emerging |
48.8% |


