
CIO outcomes are no longer IT outcomes
No one on the board asks how many servers were migrated to the cloud or how quickly a ticket was closed. They ask whether the bank stayed up during peak trading, whether store systems held up over Black Friday, and why the cloud bill went up again. That is the scorecard CIOs are accountable for today.
Our team spends most of its week working with CIOs and infrastructure leaders across banking, retail, and manufacturing. Almost all have invested in the right programs: a cloud migration, an observability tool, a service desk refresh, and a FinOps team. Each reports green. Yet the business still feels the friction.
In our experience, the cause is rarely a single underperforming program. These programs were purchased, staffed, and measured independently. The gaps between them are where outages, cost leaks, and user dissatisfaction emerge.
Picture a fairly ordinary Monday. A patch that has been deferred for two cycles gets exploited over the weekend. Monitoring generates hundreds of alerts, but the root cause sits in a tool that nobody on the bridge call is monitoring. The service desk learns about the issue from the first wave of calls. Finance notices the emergency cloud capacity costs a month later. Every team did its job. The business still had a bad day.
The old scorecard no longer works
The questions businesses ask have changed faster than most IT reporting practices. Here is the gap we see in almost every quarterly review:
What IT used to report | What the business asks now |
Servers and applications migrated | Did the migration lower our cost per transaction, or simply shift the bill? |
Uptime of infrastructure components | Could customers complete their purchases, trades, and claims? |
Tickets closed per month | Can employees do their jobs without having to contact IT? |
Patches applied this quarter | How exposed are we right now, and how long have we been exposed? |
Cloud spend against budget | What does each product cost to run, and is that cost justified? |
DR plan documented and signed off | When did we last conduct an actual failover, and how long did it take? |
The questions in the right-hand column cannot be answered by any one team. That is the central argument for treating the CIO organization as a connected system.
Five sides, one operating model
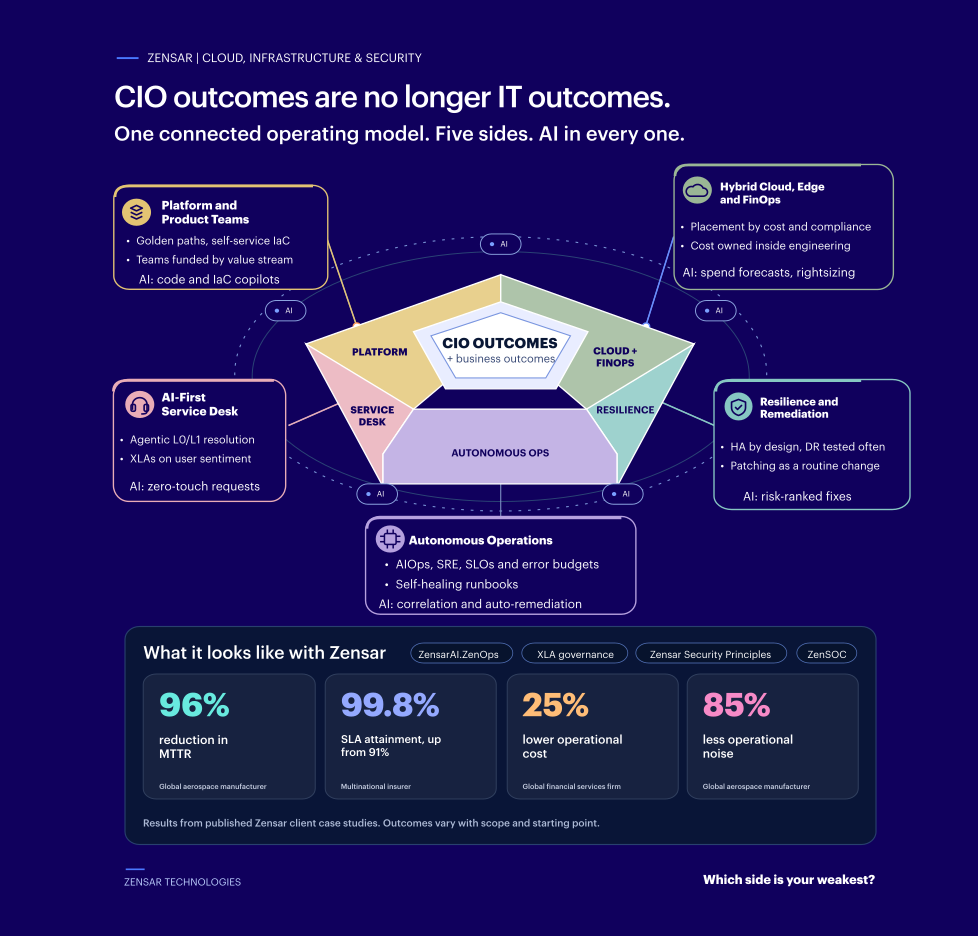
We find it easier to visualize the CIO organization as a pentagon, as shown in the graphic on the cover. CIO outcomes sit at the center, and they are business outcomes today: experience, speed, cost, and resilience. Five capabilities form the sides, with each side connected to two others. AI is not a sixth side; it runs through all five.
Remove one side, and the structure stops holding. A strong service desk cannot compensate for weak resilience, and lower cloud costs mean little if patching falls months behind schedule. The rest of this piece examines each side in turn.
A closer look at each side
1. Hybrid cloud, edge, and FinOps
Most enterprises we work with will operate a mix of public cloud, private data centers, and edge environments for years to come. That is not a problem in itself. The real impact comes when infrastructure placement is treated as a one-time migration decision and costs are reviewed only after the money has been spent. Spending increases, but nobody can connect it to business value.
WHAT GOOD LOOKS LIKE
Placement rules based on latency, data residency, cost, and resilience, reviewed every quarter
Tagging and cost allocation that let every product owner see their own bill
Stores, plants, and branches managed with the same tooling as the cloud
Commitments and reservations managed actively, not renewed out of habit
SIGNS OF NEGATIVE IMPACT
Nobody can say what one customer transaction costs to run
Cloud bill reviews happen after the spend, never before
Edge sites run on separate tools with a separate team
WHERE AI HELPS
Forecasting spending based on usage trends, flagging idle or oversized resources, and recommending where new workloads should run.
2. Resilience and remediation
This is the side we see neglected most often because it typically receives attention only after something breaks. High availability (HA), disaster recovery (DR), and vulnerability remediation are often owned by different teams and managed on separate schedules. They belong together and should be part of everyday operations.
WHAT GOOD LOOKS LIKE
HA patterns defined for each application tier and built into the landing zone
DR tested on a fixed schedule through actual failover exercises, with recovery times recorded
Cyber recovery supported by immutable backups and rehearsed restoration procedures
Patching and vulnerability fixes implemented as standard changes every cycle, with SLAs defined by severity
Open vulnerabilities tracked and reported like any other operational metric
SIGNS OF NEGATIVE IMPACT
The last actual DR test took place more than a year ago
Patch windows are postponed because of business freezes and never brought back on schedule
Vulnerability reports go to security, but nobody in operations owns remediation
WHERE AI HELPS
Ranking vulnerabilities based on actual exposure and exploitability rather than raw scores, predicting which components are likely to fail, and drafting remediation change records.
3. Autonomous operations
Most network operations centers (NOCs) we visit are overwhelmed by alerts. The goal is to generate fewer, more meaningful signals and implement more fixes before anyone has to raise a ticket.
WHAT GOOD LOOKS LIKE
One telemetry layer spanning cloud, data centers, networks, and edge environments
Service-level objectives (SLOs) and error budgets agreed upon with application owners
Event correlation that turns thousands of alerts into a handful of incidents
Self-healing runbooks for known failure patterns
Postmortems that translate lessons learned into new automation
SIGNS OF NEGATIVE IMPACT
Teams learn about outages from users
Multiple monitoring consoles exist, but nobody has a complete view
Runbooks remain in documents instead of being converted into automation
WHERE AI HELPS
Correlating events and suggesting root causes, identifying anomalies before thresholds are breached, and triggering remediation for known issues without waiting for human intervention.
4. AI-first service desk
The service desk is where employees experience IT every day. A modern service desk resolves most routine requests without human intervention and identifies problems before employees notice them.
WHAT GOOD LOOKS LIKE
Agentic AI resolves L0 and L1 requests end to end, including access, passwords, devices, and software
Proactive fixes driven by device and application telemetry
Experience-level agreements (XLAs) that track employee sentiment alongside service-level agreements (SLAs) measuring response and resolution times
Human agents focused on complex, high-impact issues
Knowledge articles continuously updated based on actual resolutions
SIGNS OF NEGATIVE IMPACT
Password resets and access requests still account for a significant share of tickets
Satisfaction surveys tell a different story from SLA dashboards
The service desk has no visibility into infrastructure events
WHERE AI HELPS
Understanding what employees actually need, resolving requests through integrations, summarizing tickets, and identifying recurring issues so they can be eliminated at the source.
5. Platform and product teams
This side connects IT to how the business is organized and funded. Without it, the other four capabilities continue to be measured as cost centers.
WHAT GOOD LOOKS LIKE
An internal developer platform with golden paths for common workloads
Cost, security, and compliance guardrails built into the development path, making the easiest approach the right one
Persistent product teams that own services from build through run
Funding aligned with value streams, with outcomes agreed upon upfront
SIGNS OF NEGATIVE IMPACT
Every new project starts with an infrastructure ticket
Teams build their own pipelines because using the platform is harder than working around it
IT funding is debated project by project every year
WHERE AI HELPS
Code and infrastructure-as-code assistants embedded in golden paths, automated policy checks, and automatically generated tests.
What the stronger CIO teams do differently
They fund outcomes. Budgets follow products and value streams, so cloud and operations decisions are evaluated against the same business results.
They design for failure. HA and DR are incorporated into every architecture review, and failover is tested on a fixed schedule. When an actual outage occurs, the response follows a rehearsed process.
They make vulnerability remediation boring. Patches and fixes move through the same pipeline as every other change, every cycle, with AI helping prioritize what needs attention first. The CISO sets the policy, and operations closes the gaps.
They put AI where the work happens. AI is embedded in the service desk, NOC, cost reports, and developer platform. A separate AI lab rarely changes how IT operates on a Tuesday morning.
They measure experience. XLAs sit alongside SLAs. A green dashboard accompanied by frustrated users still represents a miss.
They secure by design, with the CISO. Security guardrails are built into every side rather than added as a final approval gate.
A quick self-assessment
Score each side from 1 (ad hoc) to 5 (automated and measured against business outcomes). One honest question per side is usually enough to start the conversation:
Side | Question to ask your team | Score (1 to 5) |
Hybrid Cloud, Edge and FinOps | Can each product owner see what it cost to run their service last month? |
|
Resilience and Remediation | When did we last conduct an actual failover for a critical application, and how old is our oldest critical vulnerability? |
|
Autonomous Operations | What percentage of incidents do we detect before a user reports them? |
|
AI-First Service Desk | What percentage of requests are resolved without human intervention? |
|
Platform and Product Teams | How long does a new team wait for a production-ready environment? |
|
The lowest score is usually where the next incident or unexpected cost will originate.
A practical first 90 days
Nobody fixes all five sides at once, and nobody needs to. This is the sequence we recommend to most leadership teams:
Phase | Focus | What you have at the end |
Days 1 to 30 | Score the five sides, map their interdependencies, and agree on five to seven CIO outcomes with business leaders. | An outcome scorecard, a gap map, and a prioritized backlog. |
Days 31 to 60 | Deliver quick wins: reduce alert noise, automate the most common service desk requests, establish cost visibility by product, and reset the patching cadence. | Initial automation in production, a cost view for each product, and remediation SLAs defined by severity. |
Days 61 to 90 | Connect the five sides: establish shared telemetry between operations and the service desk, incorporate resilience patterns into the landing zone, and conduct the first DR test under the new model. | A connected operating rhythm, measured recovery times, and an XLA baseline. |
How we approach this at Zensar
This is the conversation our Cloud, Infrastructure, and Security team has with clients most weeks. Here is what we bring to the table:
ZenseAI.ZenOps for AIOps, observability, and automated remediation. The service desk works from the same signals that run the infrastructure.
ZenseAI accelerators for hybrid cloud, platform engineering, and FinOps, with cost and compliance guardrails set up on day one.
Our XLA governance framework, so success is measured by what users and the business actually experience.
Zensar Security Principles (Comply, Control, Contain) and ZenSOC, working with the client’s CISO team so resilience and remediation are part of the design.
Some of the results clients have achieved after working with us, as reported in Zensar's published case studies, include:
Result | What changed | Client |
96% | Reduction in MTTR, with 85% less operational noise and 45% of resolutions fully automated. | |
91% to 99.8% | SLA attainment, with MTTR reduced to 45 minutes. | |
25% | Lower operational costs, with incidents resolved twice as fast. | |
99%+ in two quarters | SLA attainment after taking over from an incumbent, along with 60 TB of storage reclaimed. |
The AIOps results were achieved using the platform now called ZenseAI.ZenOps (formerly The Vinci). Every environment starts from a different place, so these figures represent what is possible, not a guaranteed outcome.
The goal is an IT organization that the business sees as one integrated platform.
Where is your pentagon weakest?
Most CIO teams we meet are strong on two or three sides. Very few are strong across all five, and the weakest side often reveals itself through the incident nobody saw coming.
Try this exercise with your leadership team. Identify the weakest side and ask who owns it, how it is measured and what it cost the business the last time it failed. If those answers take more than a minute, you have identified your next priority.
We are interested in hearing where others stand. Which side is causing you the most trouble right now? We would be glad to compare notes.